Atelier Ten

Environmental design consultants based in London, specializing in high-performance, sustainable building solutions.

A computer monitor displays a diagram of a city with color-coded labels relating to environmental and urban planning topics, set against a dark, rocky background.

The challenge

Atelier Ten’s in-house design team are responsible for creating detailed, informative visuals to support ongoing project work. Graphic design thinking which is systems-first, pragmatic and engaging is paramount to the studio.

The solution

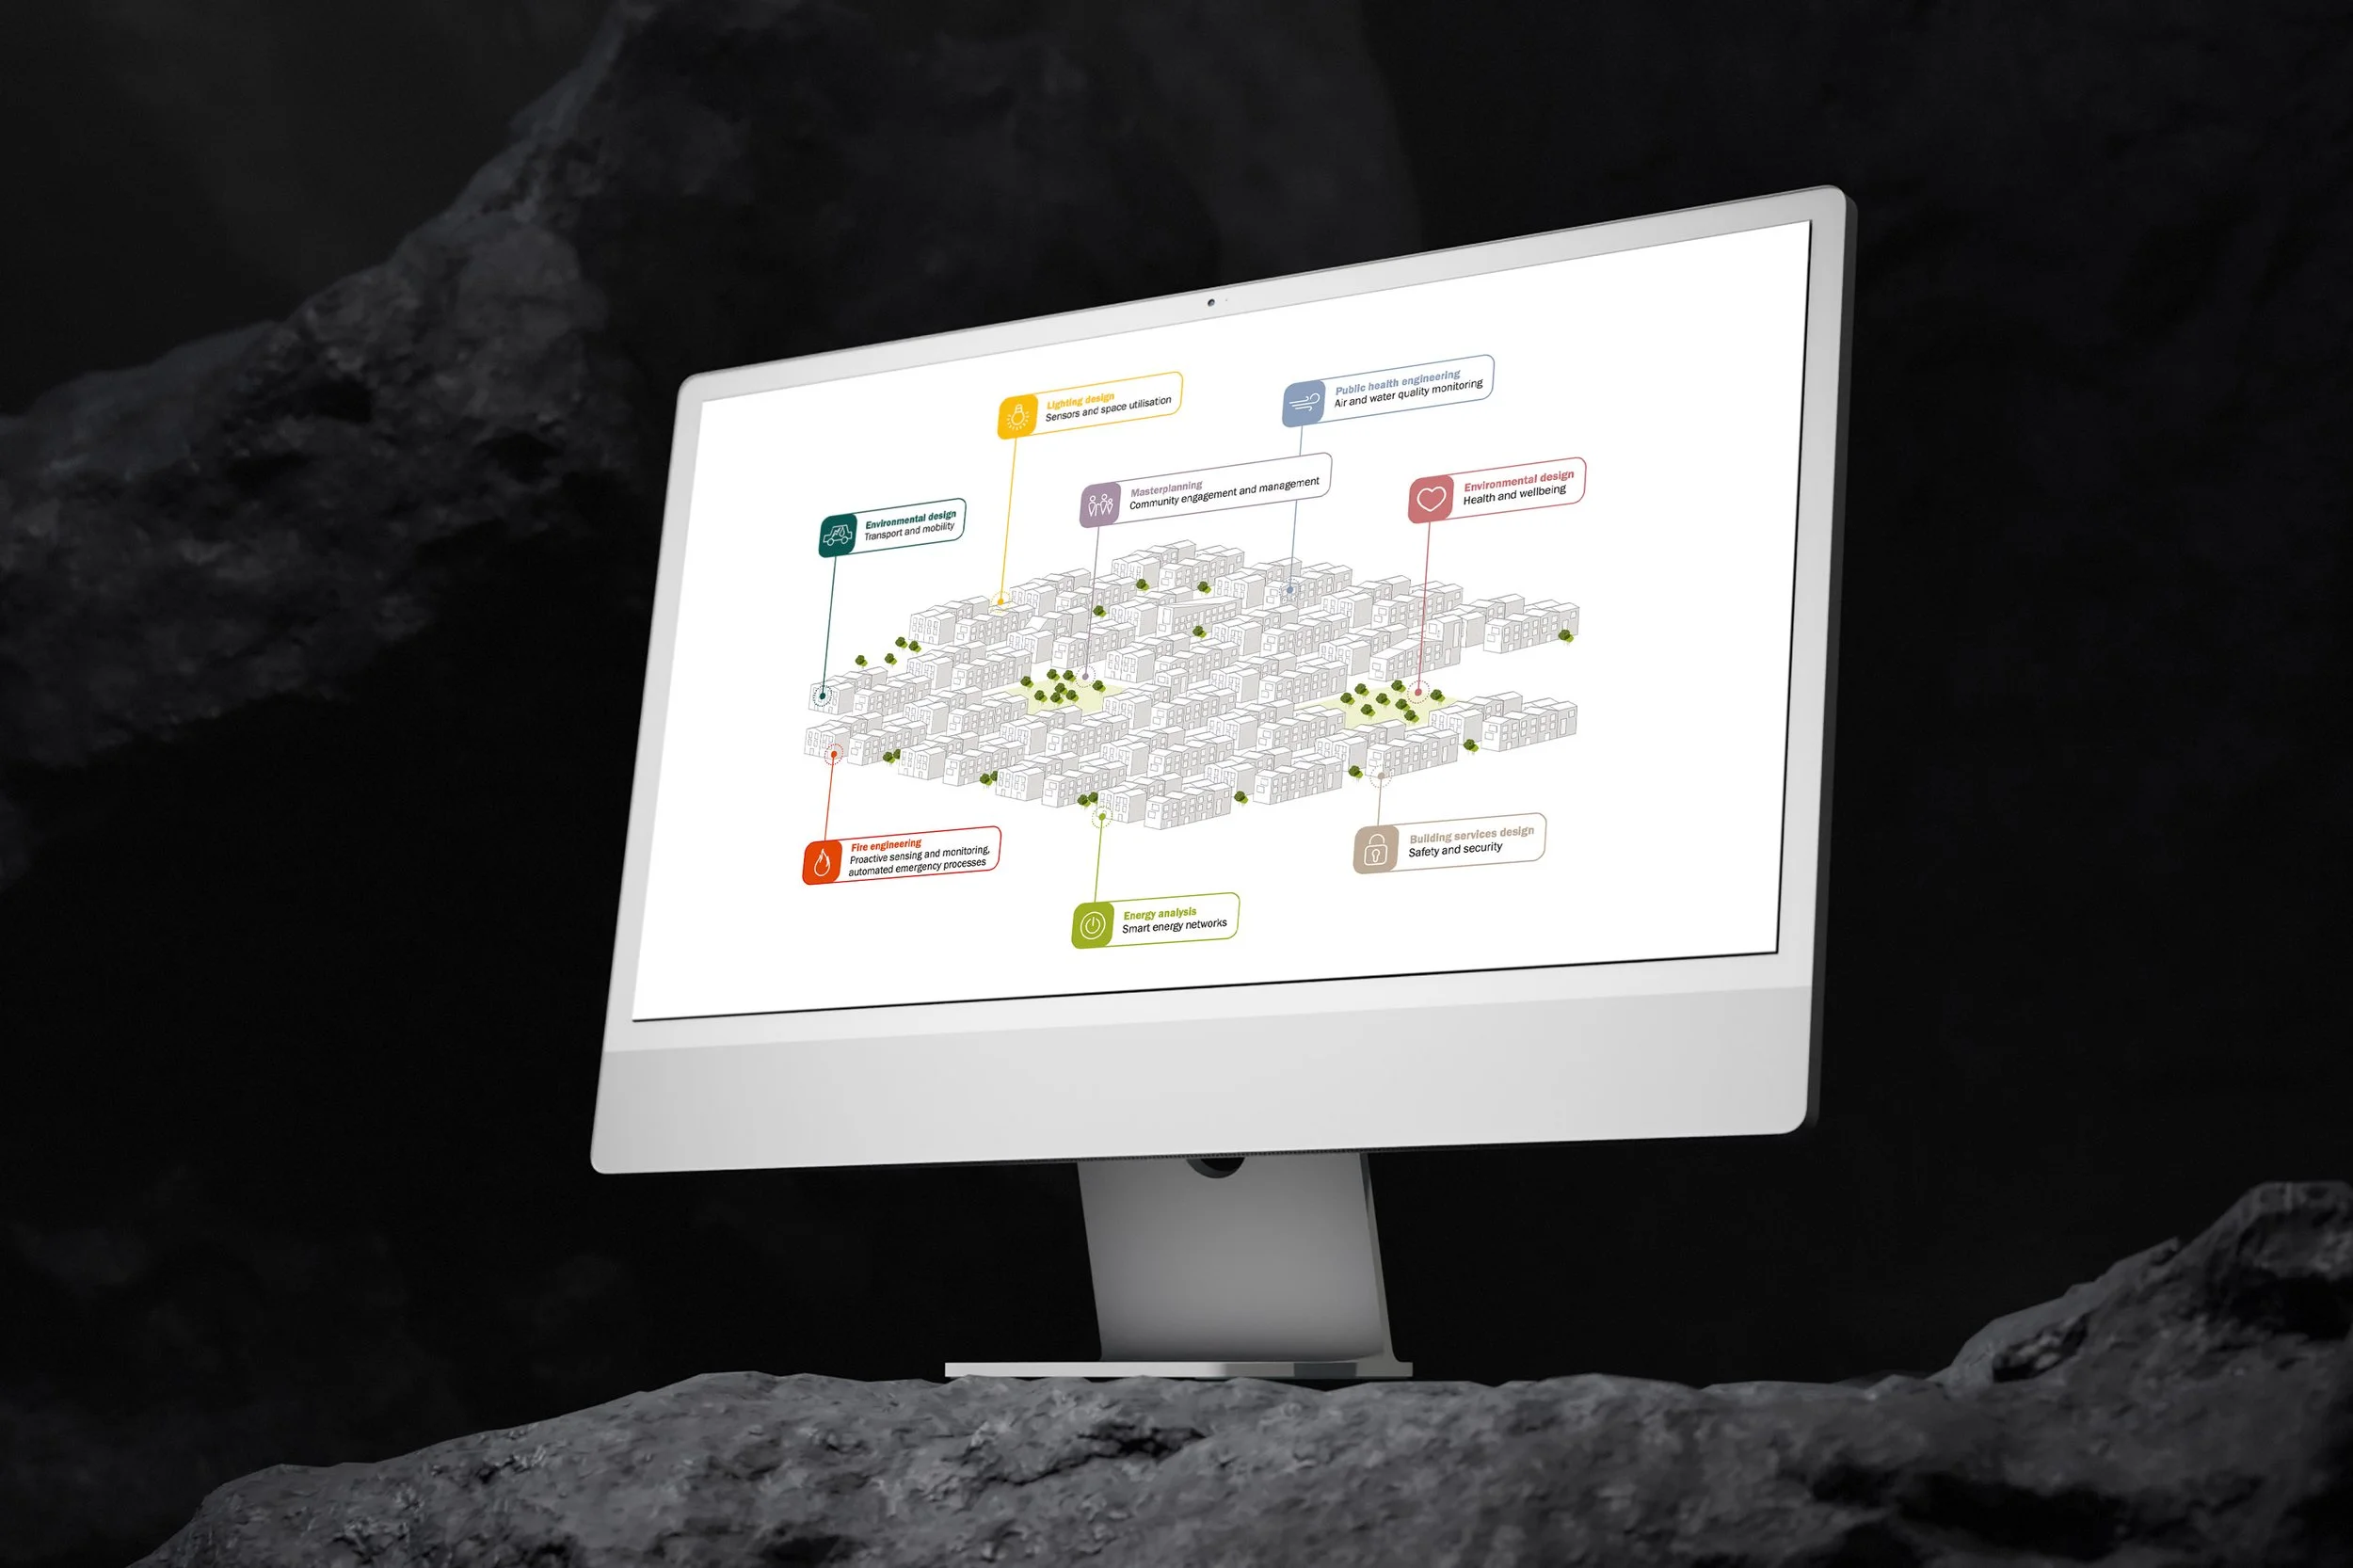
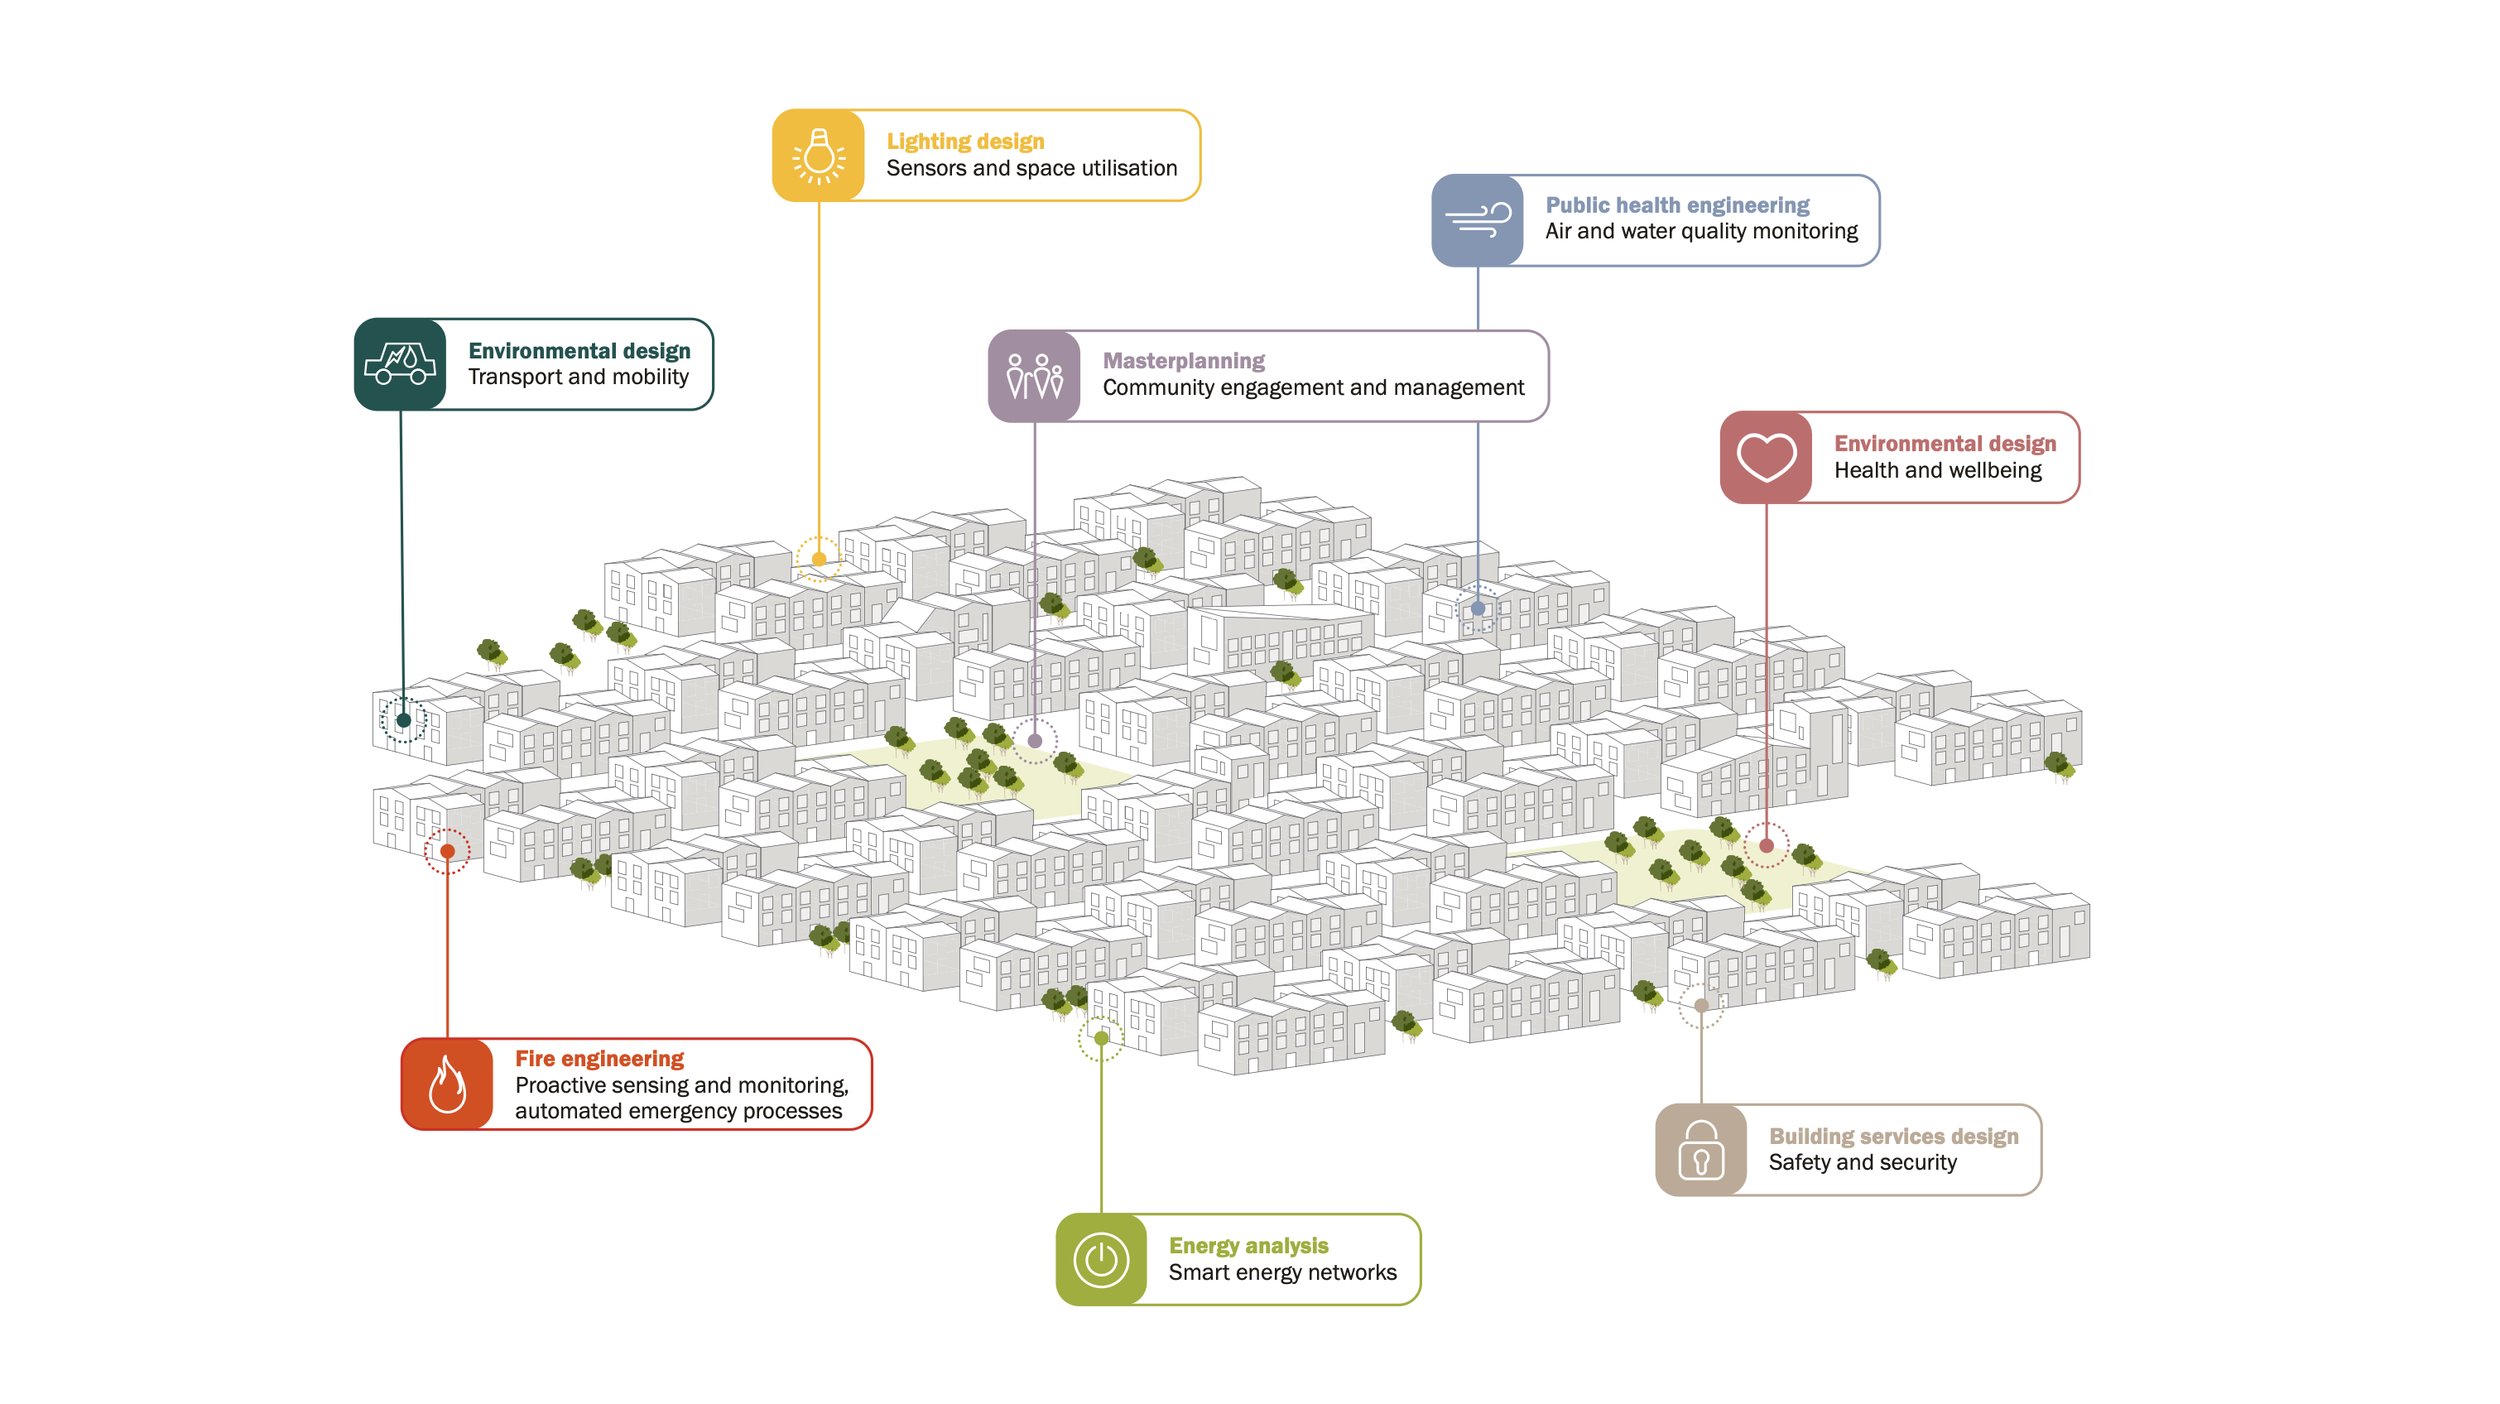
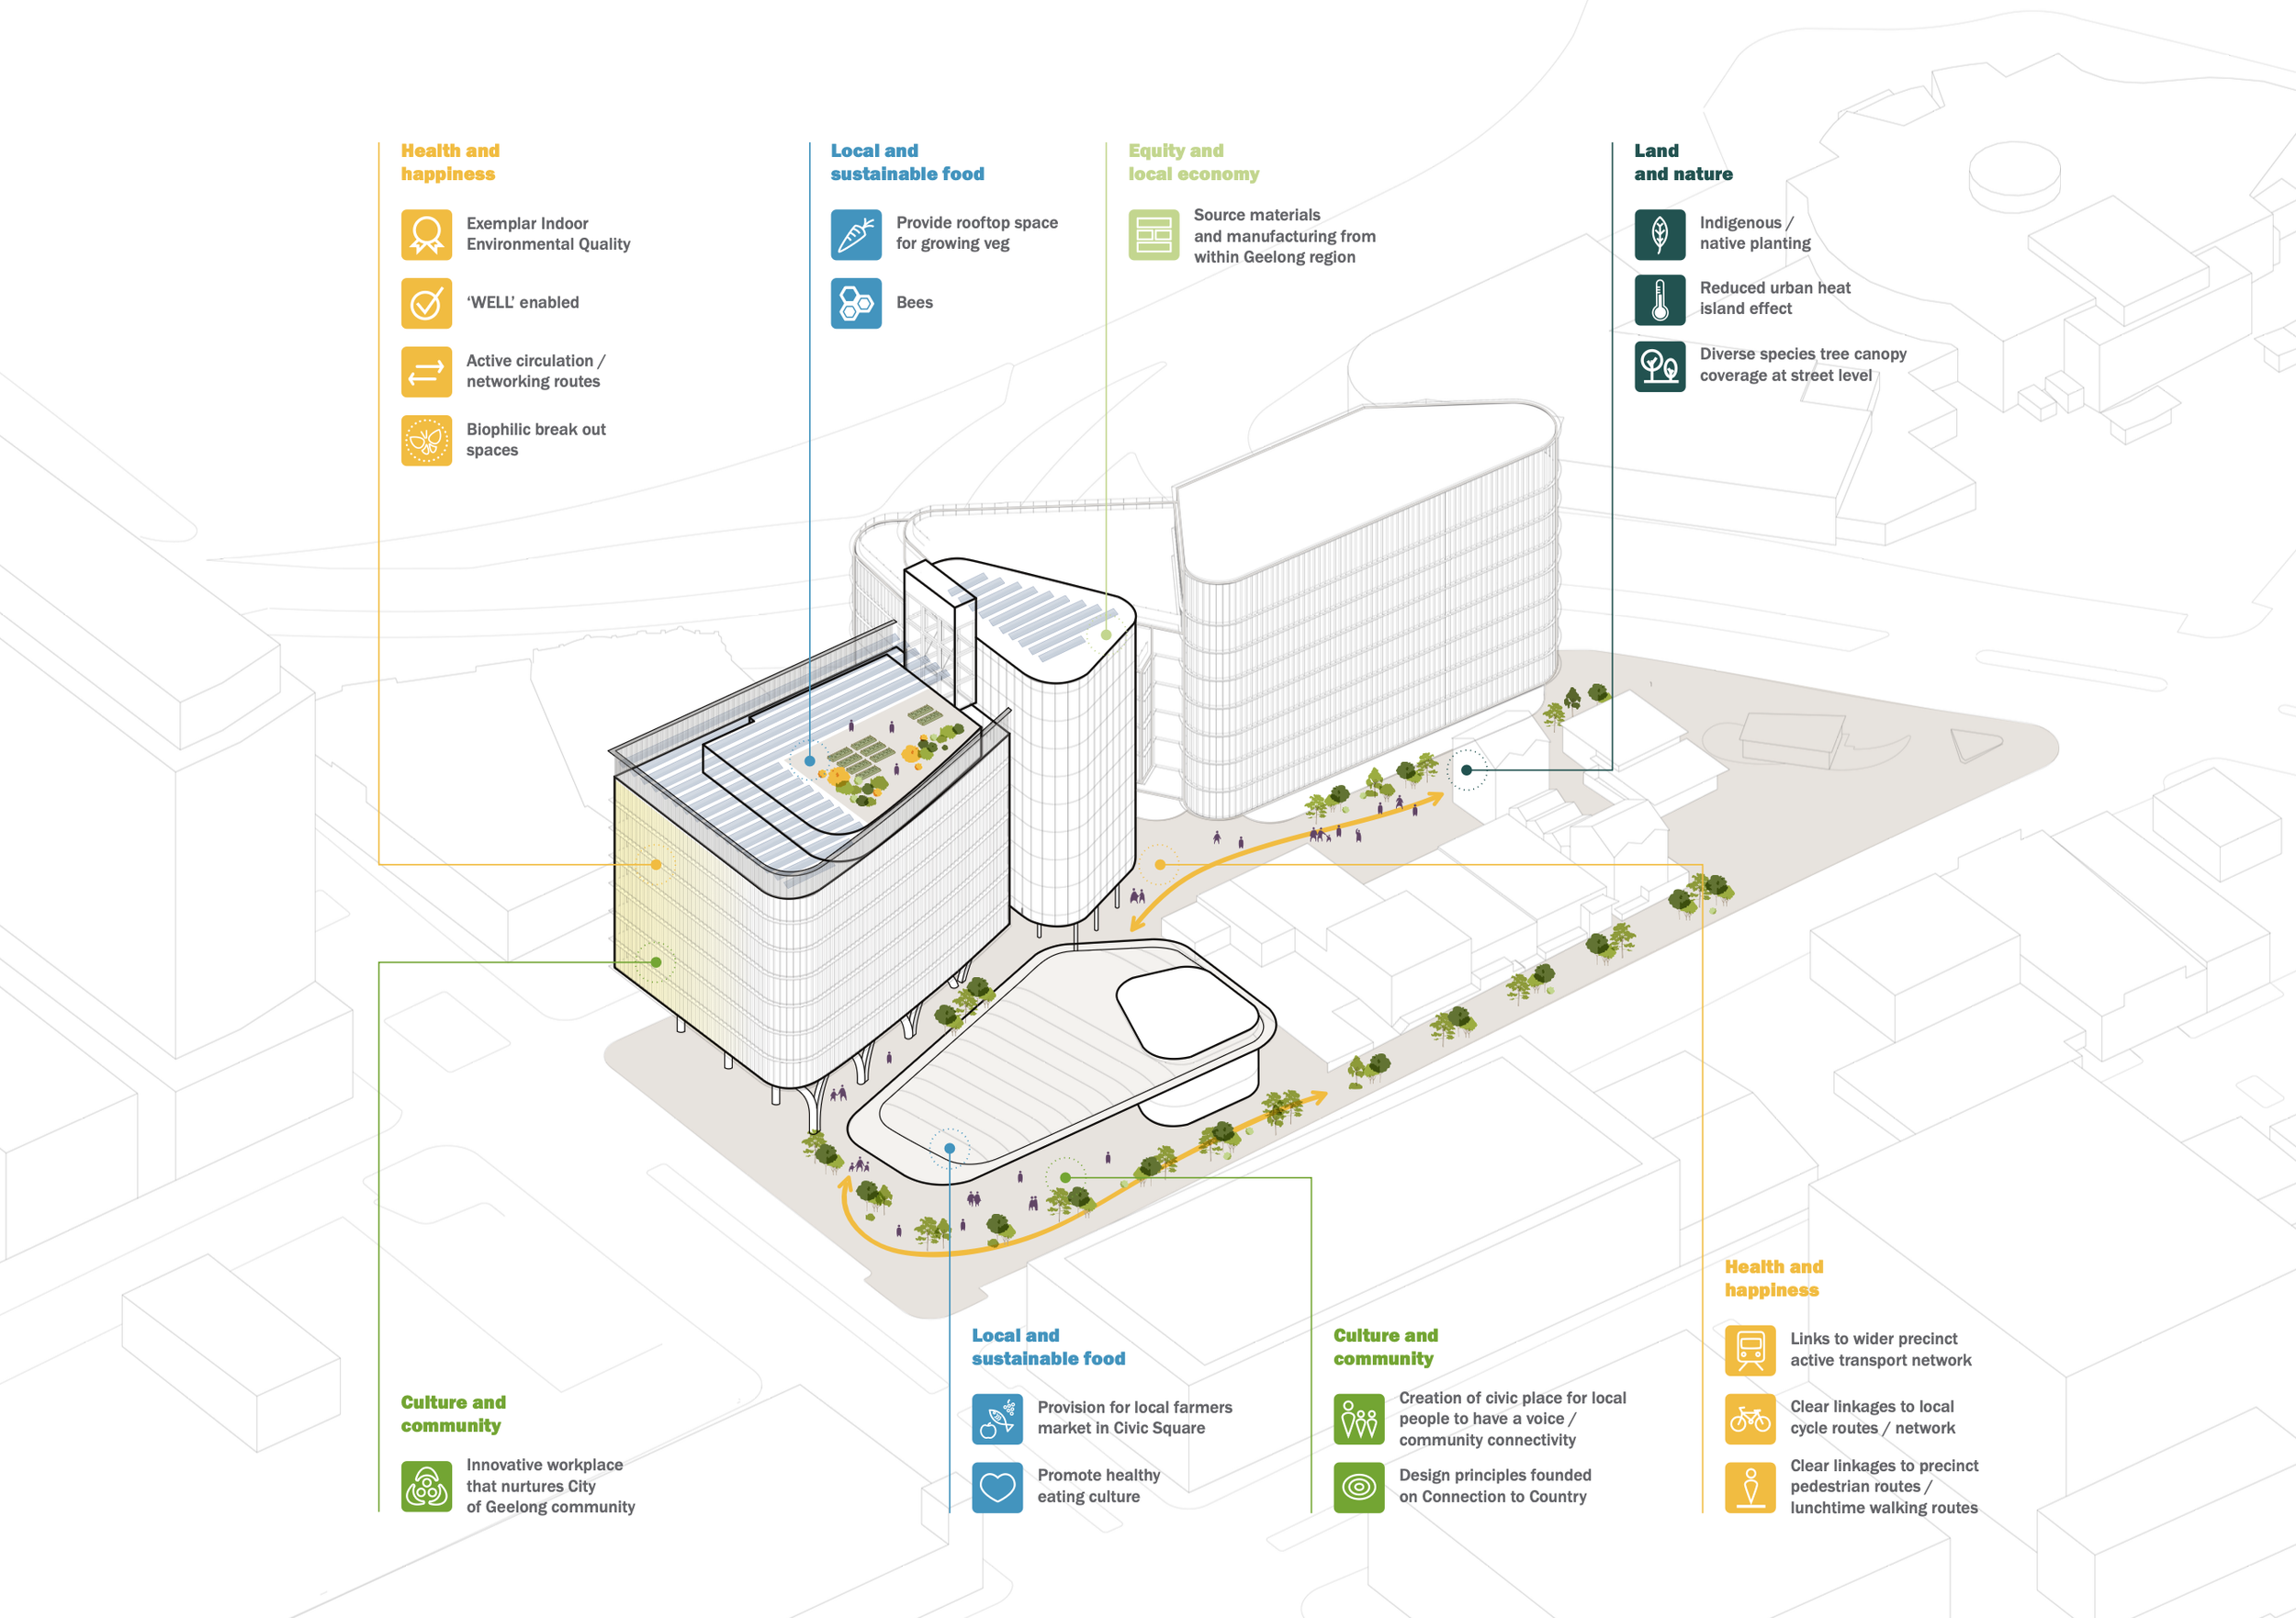
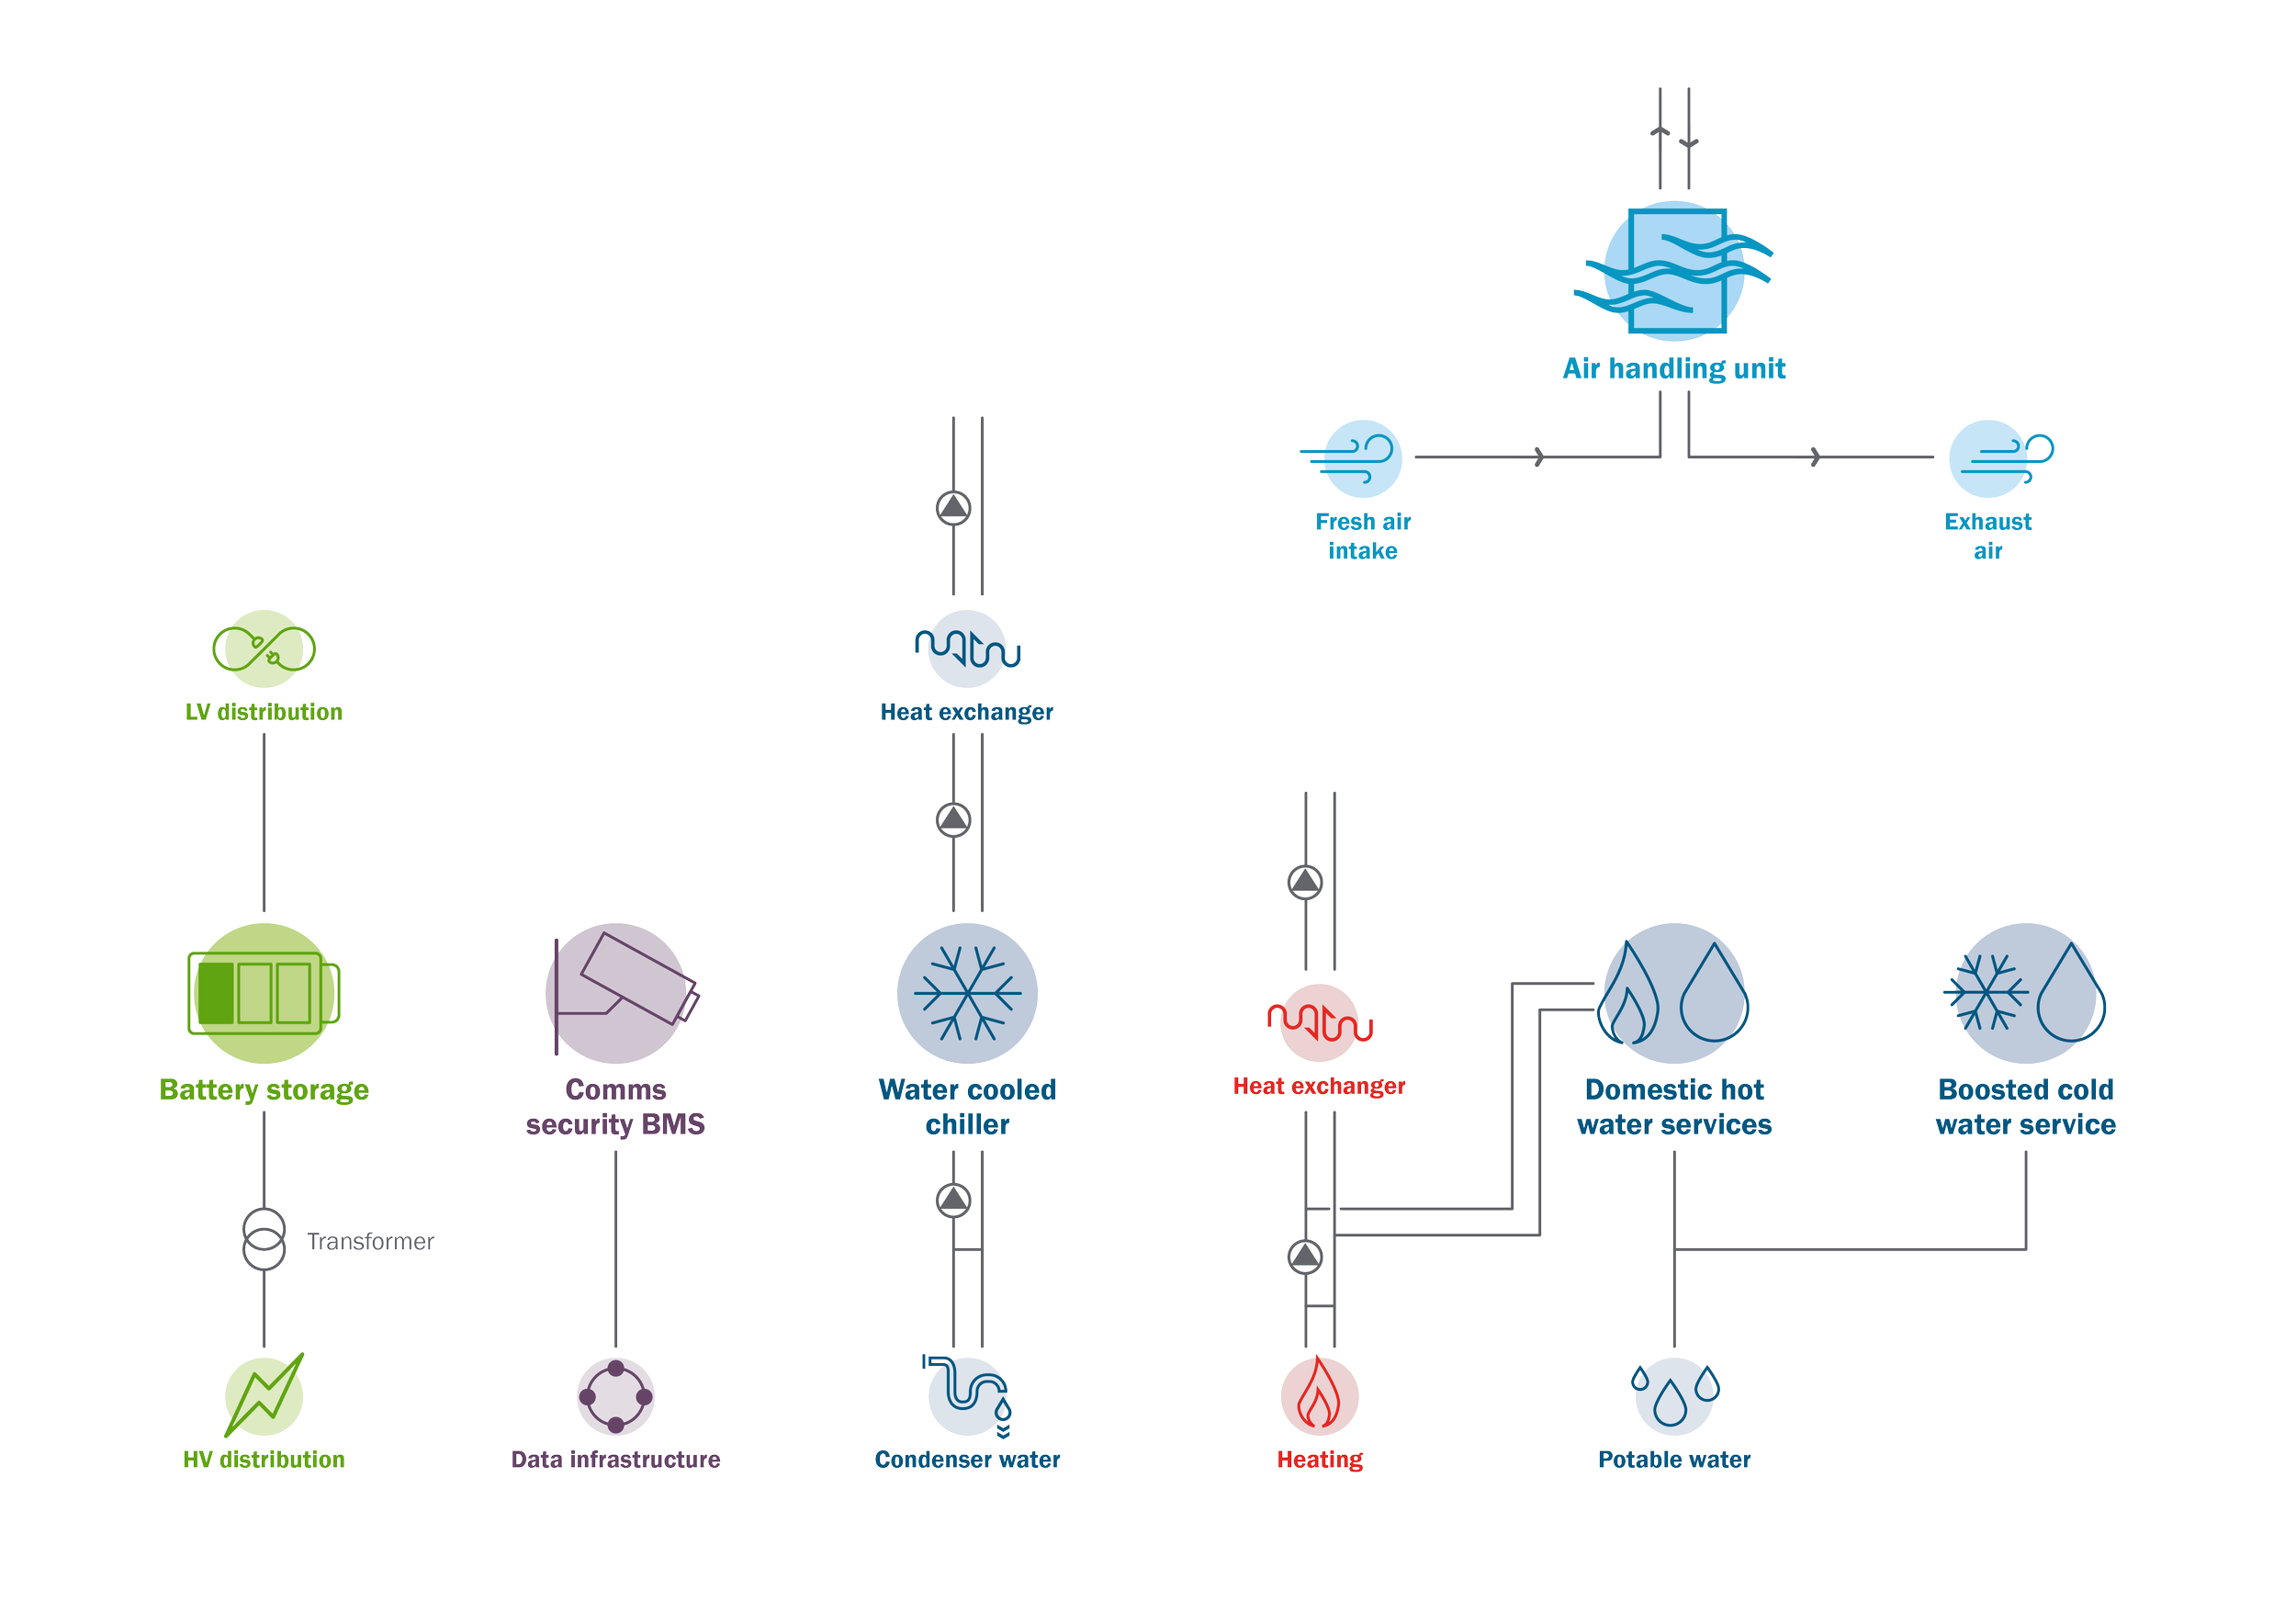
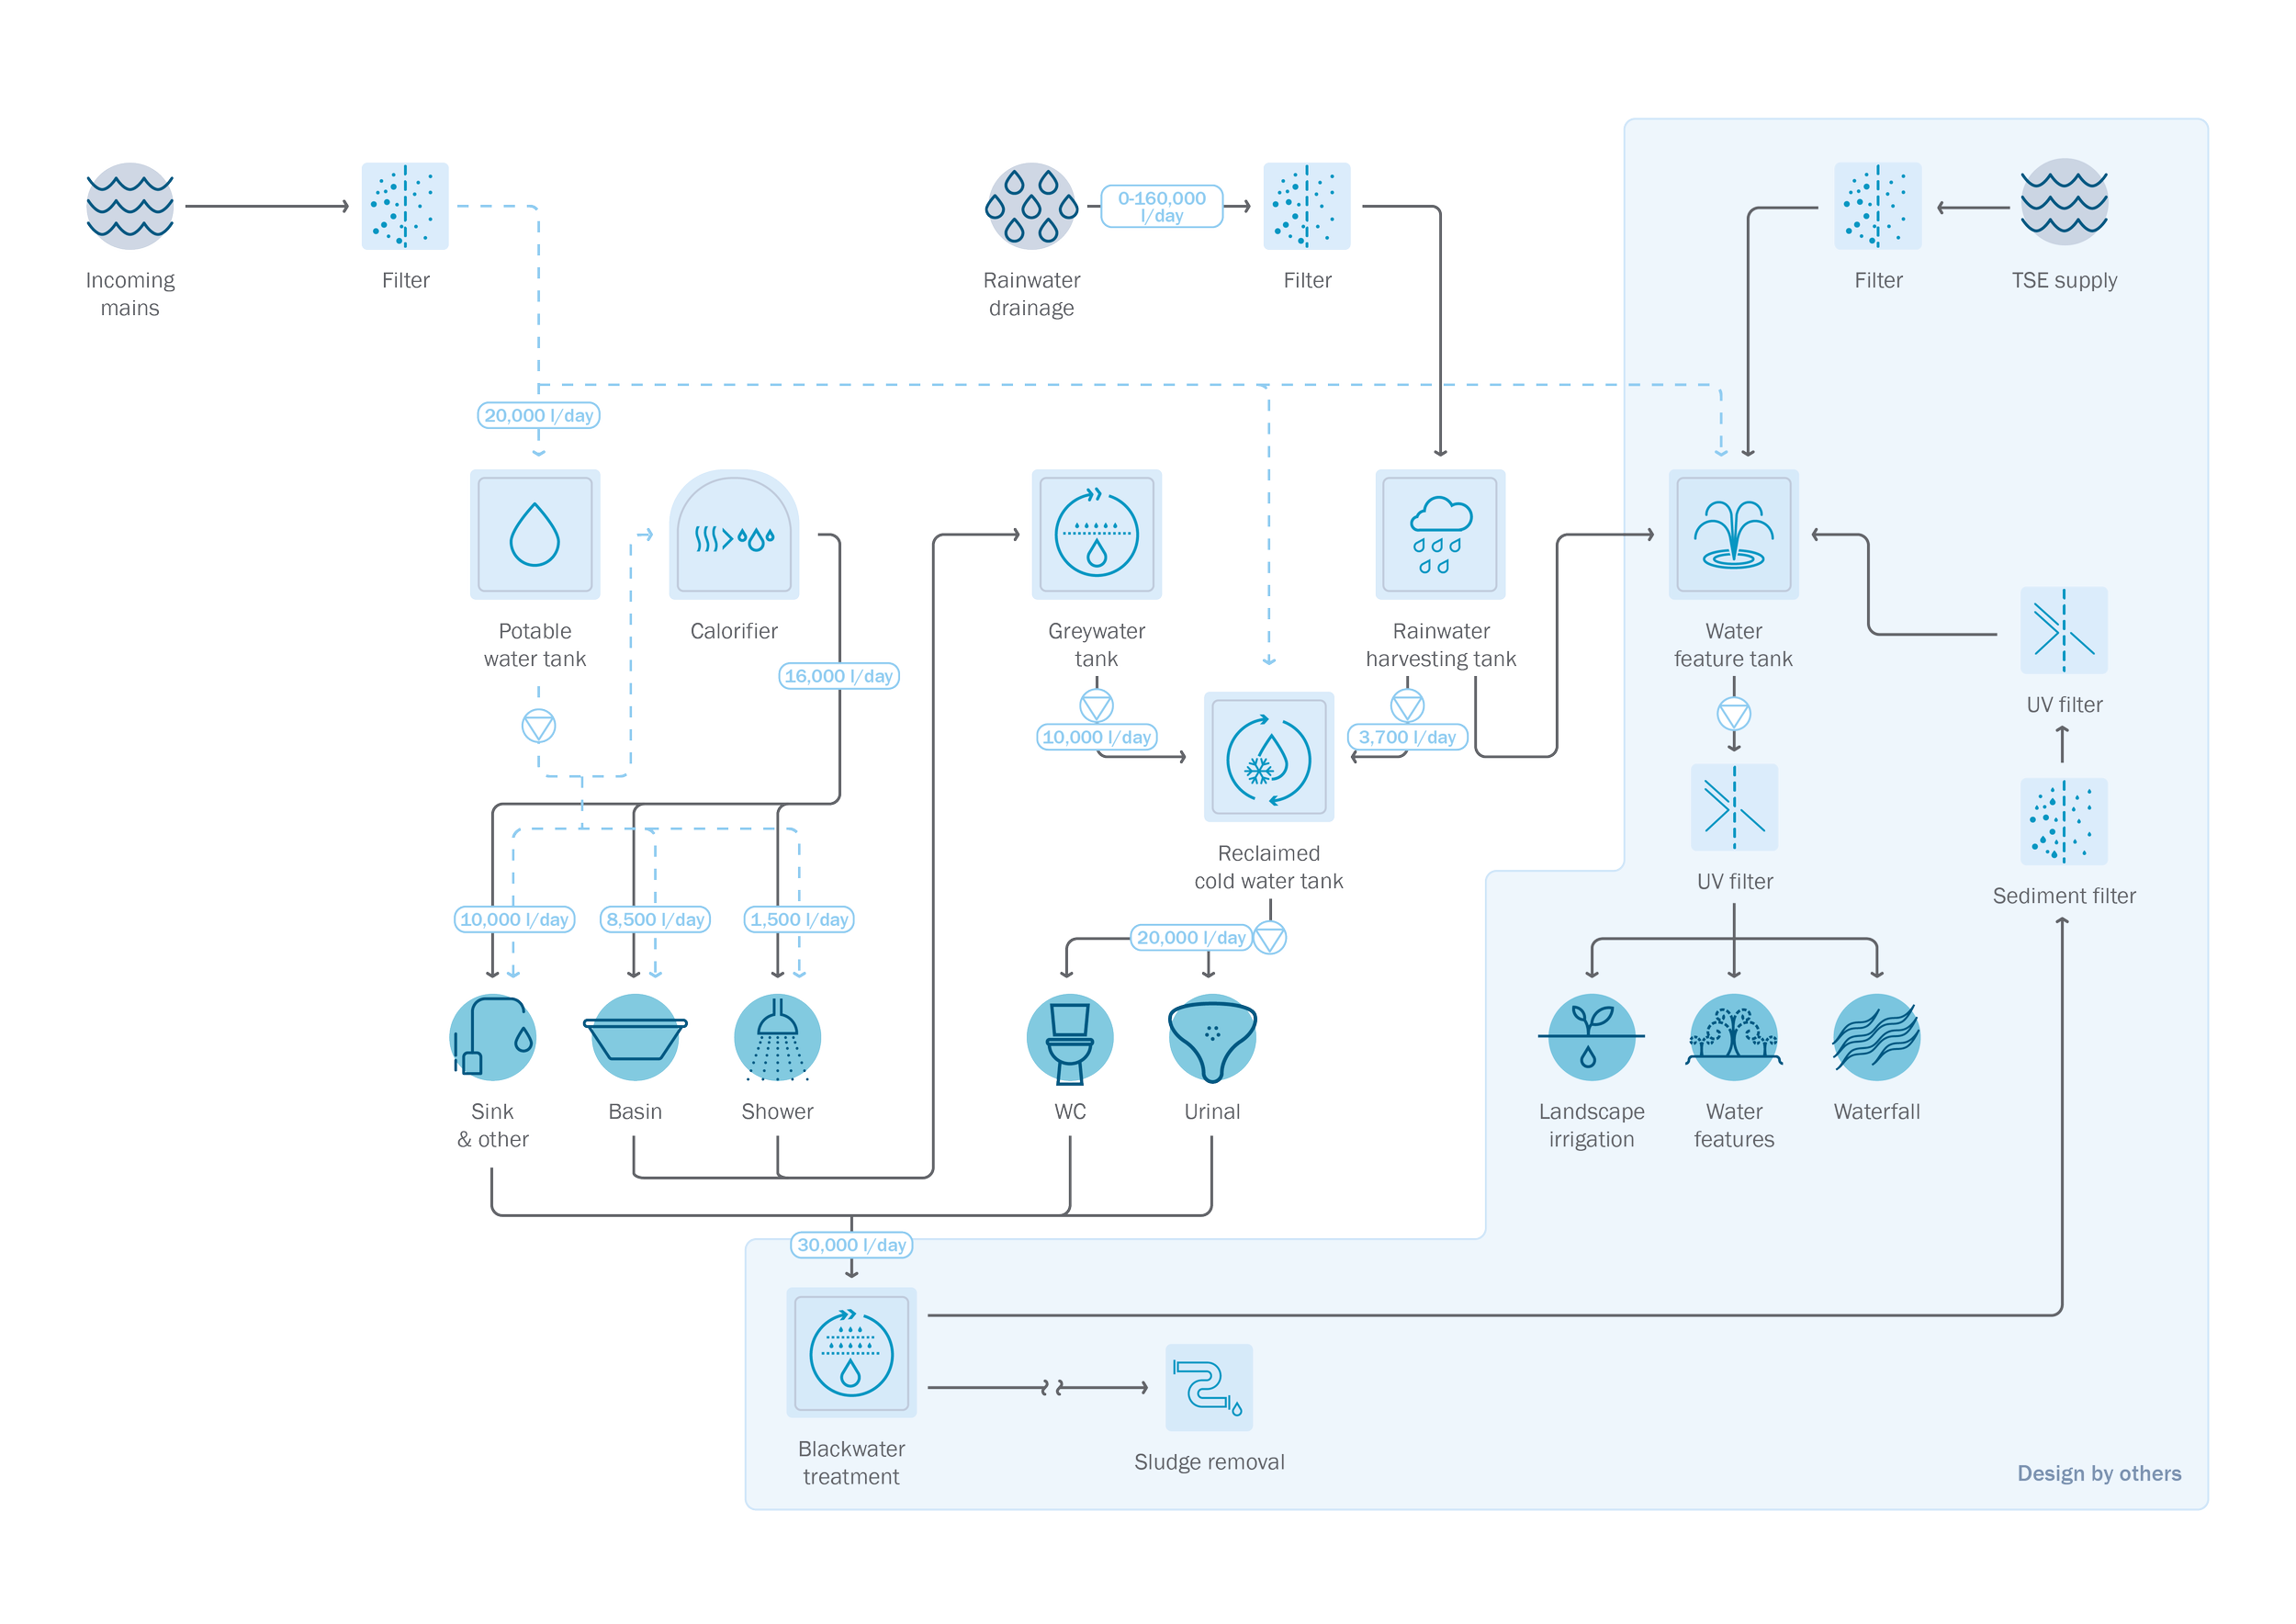
As an in-house graphic designer during a short term period with Atelier Ten, I helped create a range of axonometric diagrams and schematics, infographics and illustrations to support ongoing project work.

Scope

Artworking, Editorial design, Icon design, Illustration, Infographics, Templating

An illustration of a city with various infrastructure and technology systems highlighted, including sensors, green spaces, and buildings, with labels indicating areas like environmental design, fire engineering, energy analysis, public health engineering, master planning, lighting design, environmental design, and building services design.
A diagram presenting various aspects of urban planning and community development, categorized into five main themes: Sustainability, Intelligence, Happiness, Safety, and Connectivity. Each theme has related outdoor and indoor experience points, represented with icons and brief descriptions, focusing on energy sources, community potential, accessibility, security infrastructure, community engagement, and environmental systems.
A colorful diagram of a new development project with labels in different sections indicating features related to health, local food, sustainability, community, and land. The diagram shows a multi-story building with rooftop gardens, icons representing eco-friendly and community features, and pathways with trees surrounding the buildings.
Diagram of a district energy system showing components like LV distribution, battery storage, heat exchanger, water cooled chiller, domestic hot water services, boosted cold water service, air handling unit, fresh air intake, exhaust air, and heat exchangers.
Diagram of a water treatment process showing steps from incoming mains water going through filtering, rainwater drainage, calrifier, and tanks for greywater and rainwater, with additional filtration and UV treatment, leading to various uses including sinks, basins, showers, toilets, irrigation, water features, and a waterfall.

Design takeaways

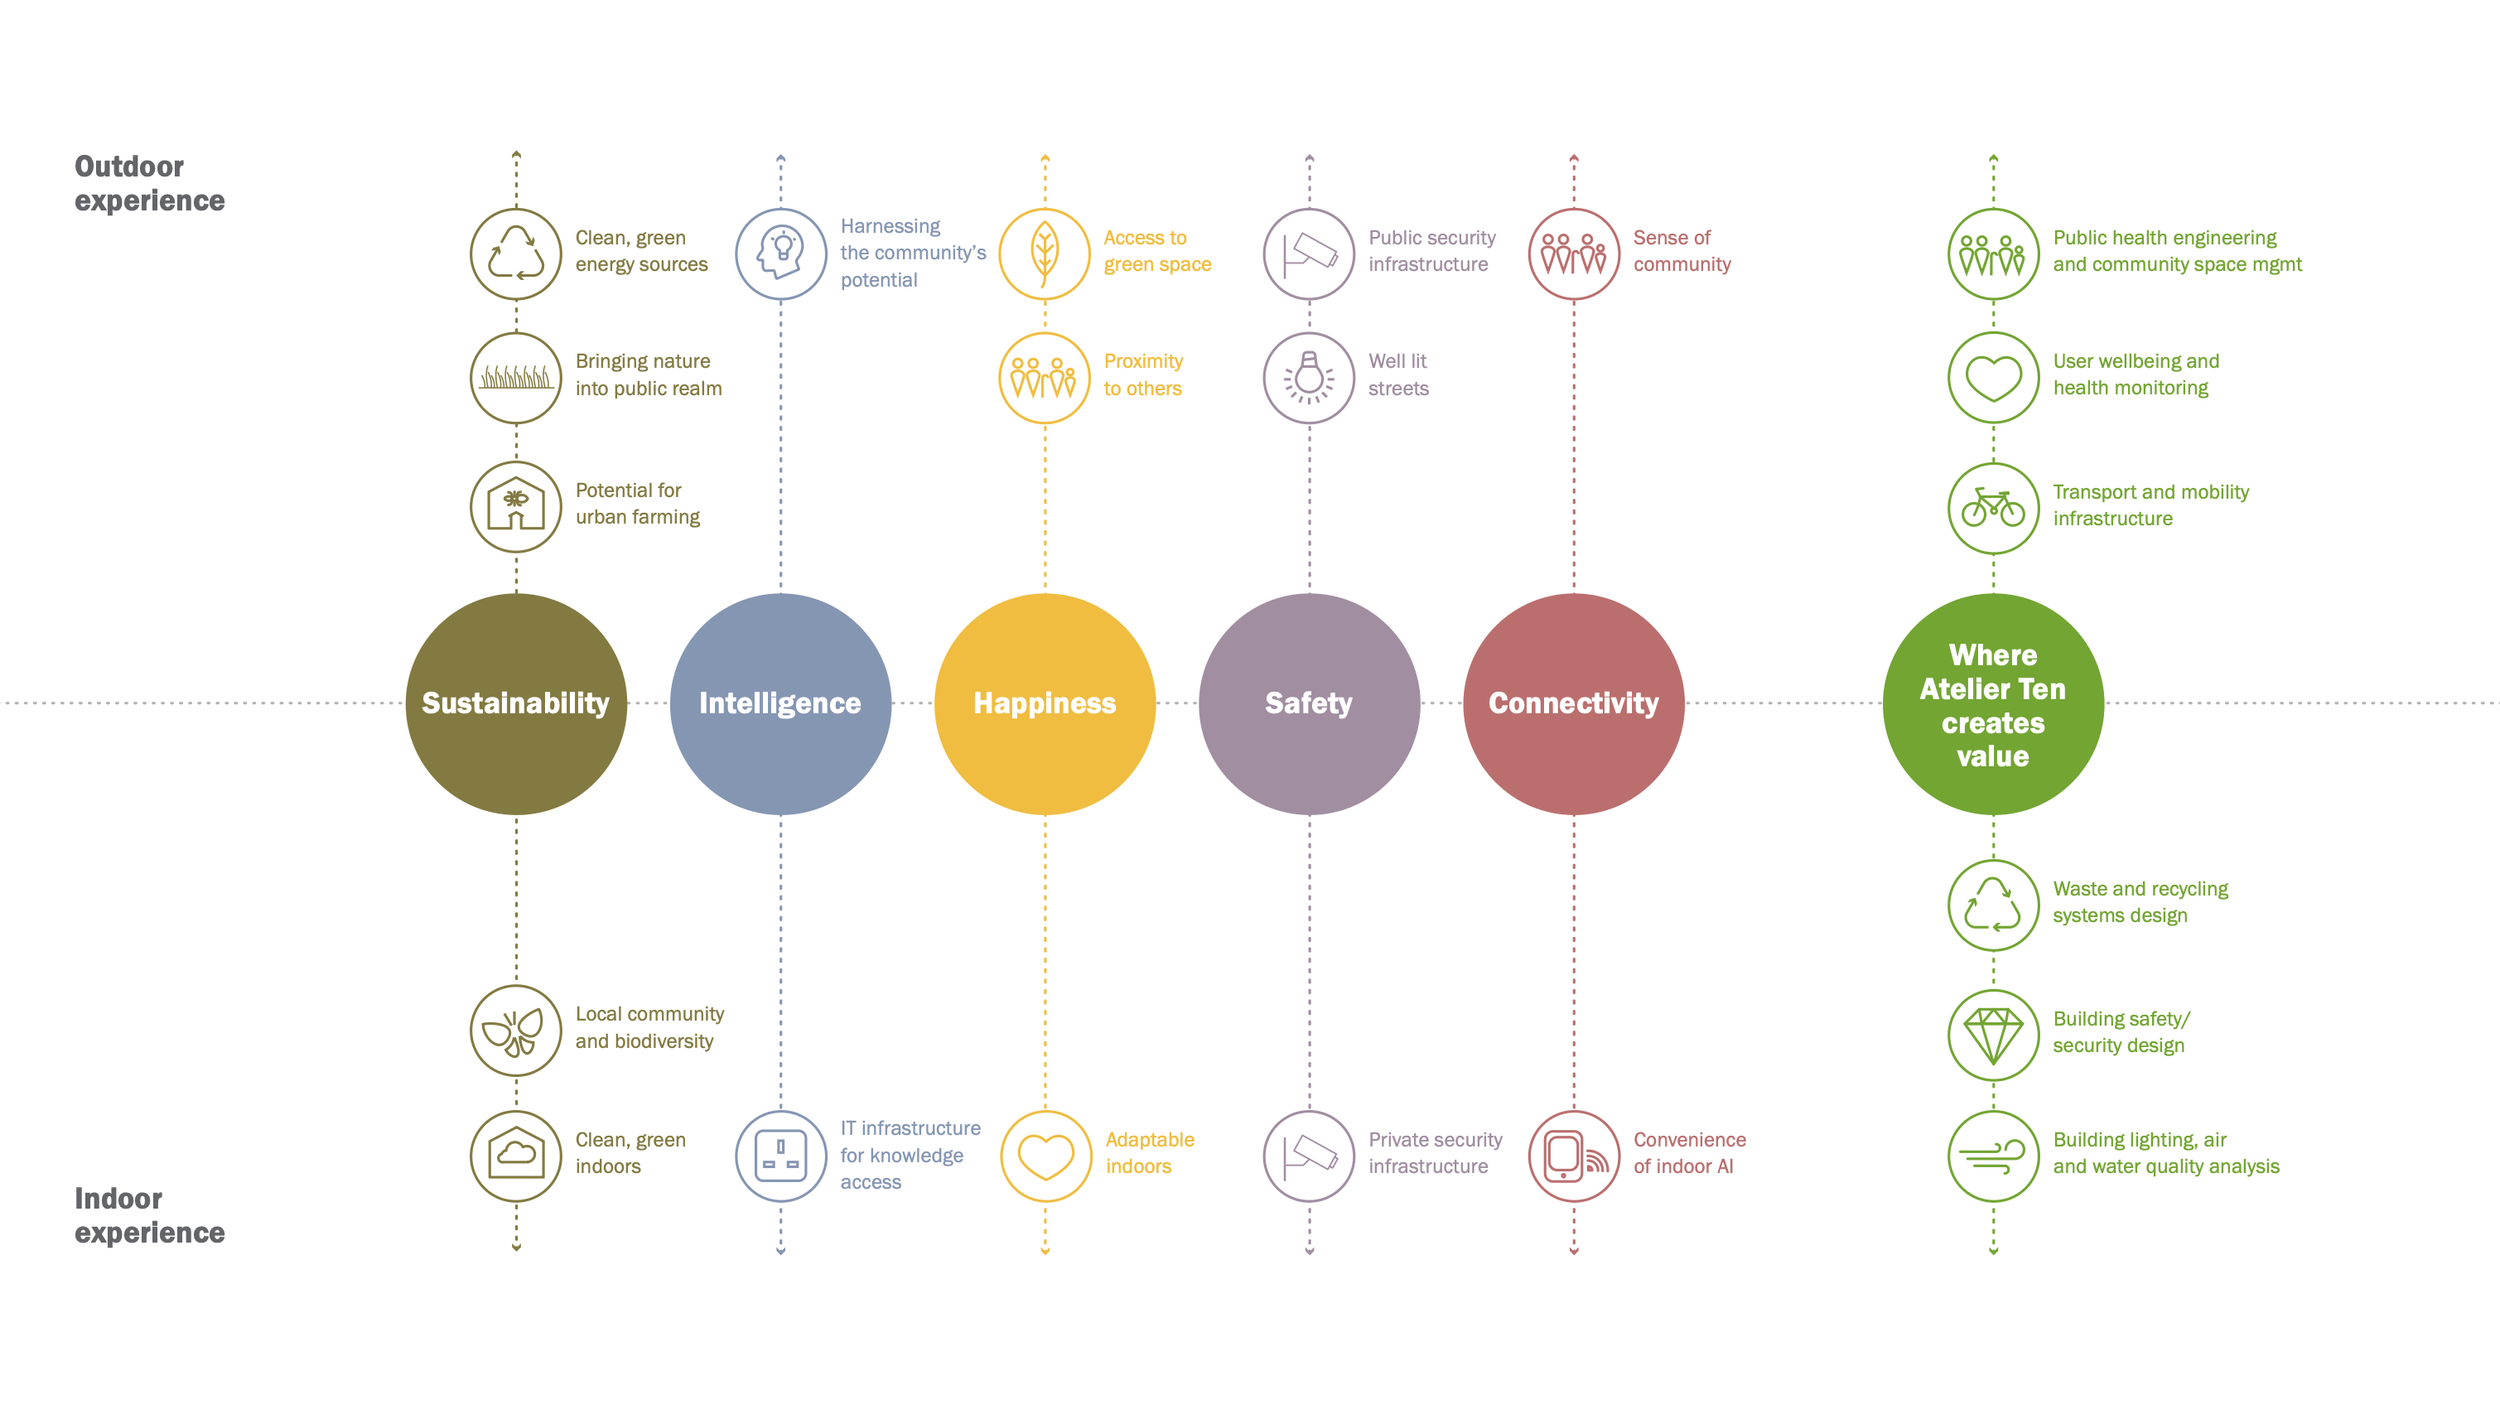
  • The importance of clarity in infographic design. Clear infographic design matters because infographics are meant to compress information into something people can understand quickly. Without clarity, even visually attractive graphics fail at their main purpose: communication. In this case, the level of design detail which went into creating each diagram was the main learning curve for me.

  • Information creates credibility. Another aspect of clear data visualisation design is noting how confusing visuals can make data seem unreliable or manipulative. Clear infographics appear more professional and trustworthy because audiences can easily verify and follow the information.

Let’s work together

If you have a similar project you’d love a new design perspective on, get in touch with me at hello@chromakane.com – I look forward to finding out about your brand’s story.